Data Templates
Connect your data template to your slide
- STEP 1: Download the data template from the:
- Vibe PortalAfter you have created your new slide, select File Upload in the Content Source dropdown.Click the Download button to save a copy of the data template locally.OR,
- Vibe Help Center
Check out the Template Library articles to download data template examples or a blank copy that you can use to add your own data/messages/events.
- Step 2: Choose your preferred content sourceWith data templates, you can manually upload your latest file into the Vibe Portal or centrally manage all of your data templates in Google Sheets or SharePoint.
- File Upload - Update the file locally and save your changes. Then, upload the file to your slide.
- SharePoint / Google Sheets
- Existing data integration
- Setup a folder in Google Drive or SharePoint
- Copy the data template (XLSX) into your new folder
- In the admin console, add the folder path to your API settings
(read more Google Sheets or SharePoint) - In the Vibe portal
- Select your data source in the Content Source dropdown
- Select your data file in the 'Data' dropdown
- New data integration
Chat with your Vibe Coach or the Vibe.fyi team about upgrading your subscription to include a SharePoint or Google API data integration.
Common Data Entry formats
Tips and tricks when managing your data in a spreadsheet:
| Data Column | Supported Formatting |
| Title | Free format (alpha, numeric, etc) |
| Summary | Free format (alpha, numeric, etc) TIP: Use ALT+ENTER to add a line break |
| Date | DD/MM/YYYY or MM/DD/YYYY |
| Image | Both PNG & JPG formats are supported. The way you reference an image file in this column will depend on the content source you have chosen:
|
| Time | HH:MM AM or HH:MM PM |
Tips
Set the correct slide duration
If the slide Duration field does not show "seconds per item" and the slide shows only one spreadsheet row at a time, we need to set a duration value that covers all spreadsheet rows. The steps to find the correct duration value are as below:
- Find a spreadsheet row that will take the longest time to show on the slide
- When the slide starts showing the content of that row, monitor the clock to measure the time until the slide animation completes.
- Enter the counted seconds into the slide Duration field.
Slide not updating?
Check the name of your sheet and try renaming it to 'Sheet1'
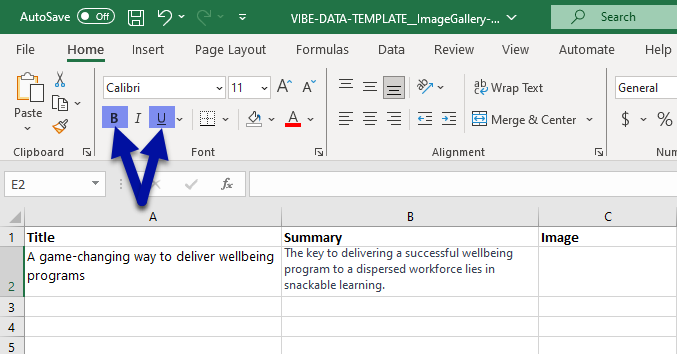
Text Formatting
Make your content stand out using Bold and Underline formatting.
Related Articles
Data (Multi-Bubble)
Slide Inspo Forget static BI dashboards! Use the Data-MultiBubble template to share relevant info only and bring your data to life. Data Template tips Step 1: Download the data template from your slide portal. Step 2: When editing your XLSX file, use ...Data (Plot)
Create a Data (Plot) slide Manage via web portal Create a new slide using the Data (plot) In the slide editor > Attributes tab, select the Web Portal content source option To add your data to then Graph list item, Select Graphs Click the Plus button ...Data (2 Dials)
Net Promoter Scores are great to show your team and employee how they are performing in comparison to a national standard. This 2-dial design is ideal for showing your Weekly or Monthly NPS score for two feeds. You can compare your Industry standard ...Data (Days Since)
Use these ideas for inspiration when creating your next slide: Day Count (# of days since the event took place) Data Insights - Single Day Count Data Insights - Multiple Day Counts (wait a few seconds to see the transition...) Manage via web portal ...Data (Dial Comparisons)
Visually compare differences between key metrics such as NPS scores, revenue, costs and more. Check out this video for inspiration: Create a Data Dial Manage via web portal Create a new slide using the Data (Dial Comparisons) template In the slide ...